City in the Eyes of AI
Urban Feature Prediction System Based on AI and Big Data
Project Type
Digital Future 2021
Summer Workshop
Team
Xiaohan Ren
Yao Wang
Weihao Yin
My Role
Product Designer
Researcher
Contribution
Research
Data Visulization
High-fedelity prototype
Tools
GIS
Grasshopper in Rhino
Figma
Phyton
Anaconda
Instructor
Hao Zheng
(PHD of Upenn)
ZIXUN HUANG
(data science instructor)

BACKGROUND
01 Urban Vitality
The vitality level of urban spaces can be reflected in Urban dweller’s activity mappings. The data that generates these mappings usually are generated by data from social media (restaurant reviews, popular places posts, etc.), representing the popularity and commercial potentials in urban areas. Nowadays, the vitality level of urban spaces is not only affected by the physical presence - if it is an open space or near city centers, but is highly shaped by social media data in a bottom-up way.
.png)
02 Design Challenge
There are already use cases to better understand the commercial potentials using review data from Yelp or Airbnb, but in some countries like China, there is no open-source data available for this type of data mapping. Also, for some cities with underdeveloped tourism, the lack of data is an issue as well. Therefore, what this design focuses on is:
How can we predict the potential high vitality-level urban spaces when there is limited data access.
SOLUTION
01 Overview
As a decision-making tool, artificial intelligence has been widely used in many fields. The generative adversarial network is a framework model in machine learning, which is specially used to learn and generate image-type data. Based on this characteristic, we first collected data and generated pairs of base images of one city with developed tourism, and then trained AI to predict the corresponding results of another city that lacks data. Finally, we applied this training outcome to a real use environment and designed a product to help predict the vitality of urban space and guide users to better choose potential places.
02 Technical Path


PROCESS
01 Data collection & visualization
There is no open-source database in China, so to collect the data generated by users, we used a python script to download the comment number from “DianPing”(“Yelp” in China) and also their coordinates of popular places(rated beyond 4 stars, 5 in total) in metropolitan Shanghai. (Tool: python)
Data Collection

Data Cleaning

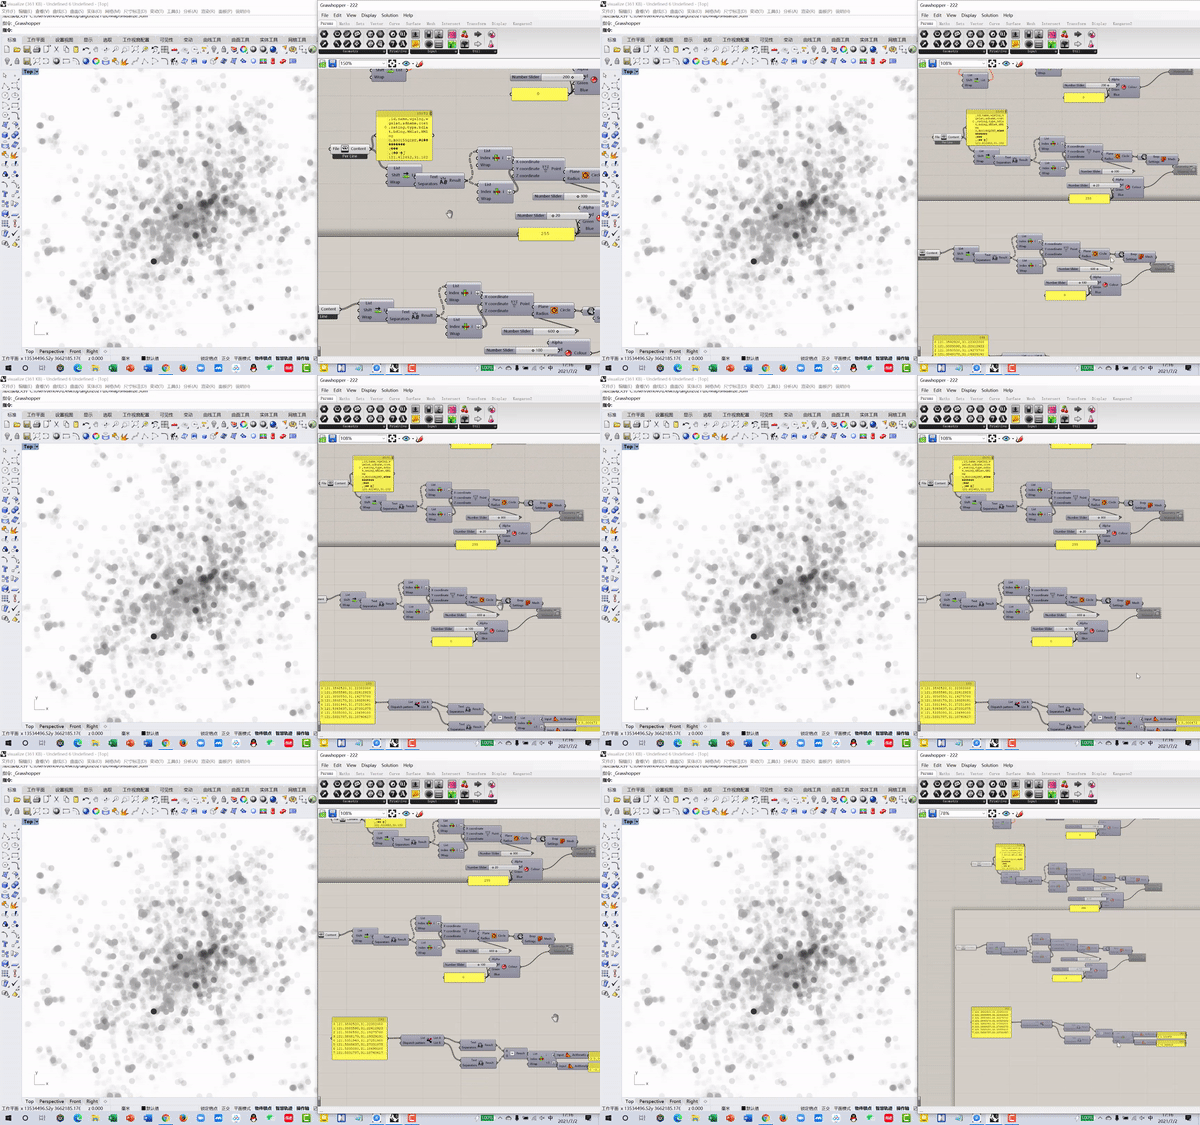
After cleaning and cataloging the data, we visualized each place as a point with a gradient of black, the darker, the more comments happened. Later, all points were layered together to generate a POI hot map. (Tool: Rhino+Grasshopper)
Data Visualization

02 Model training, testing and prediction
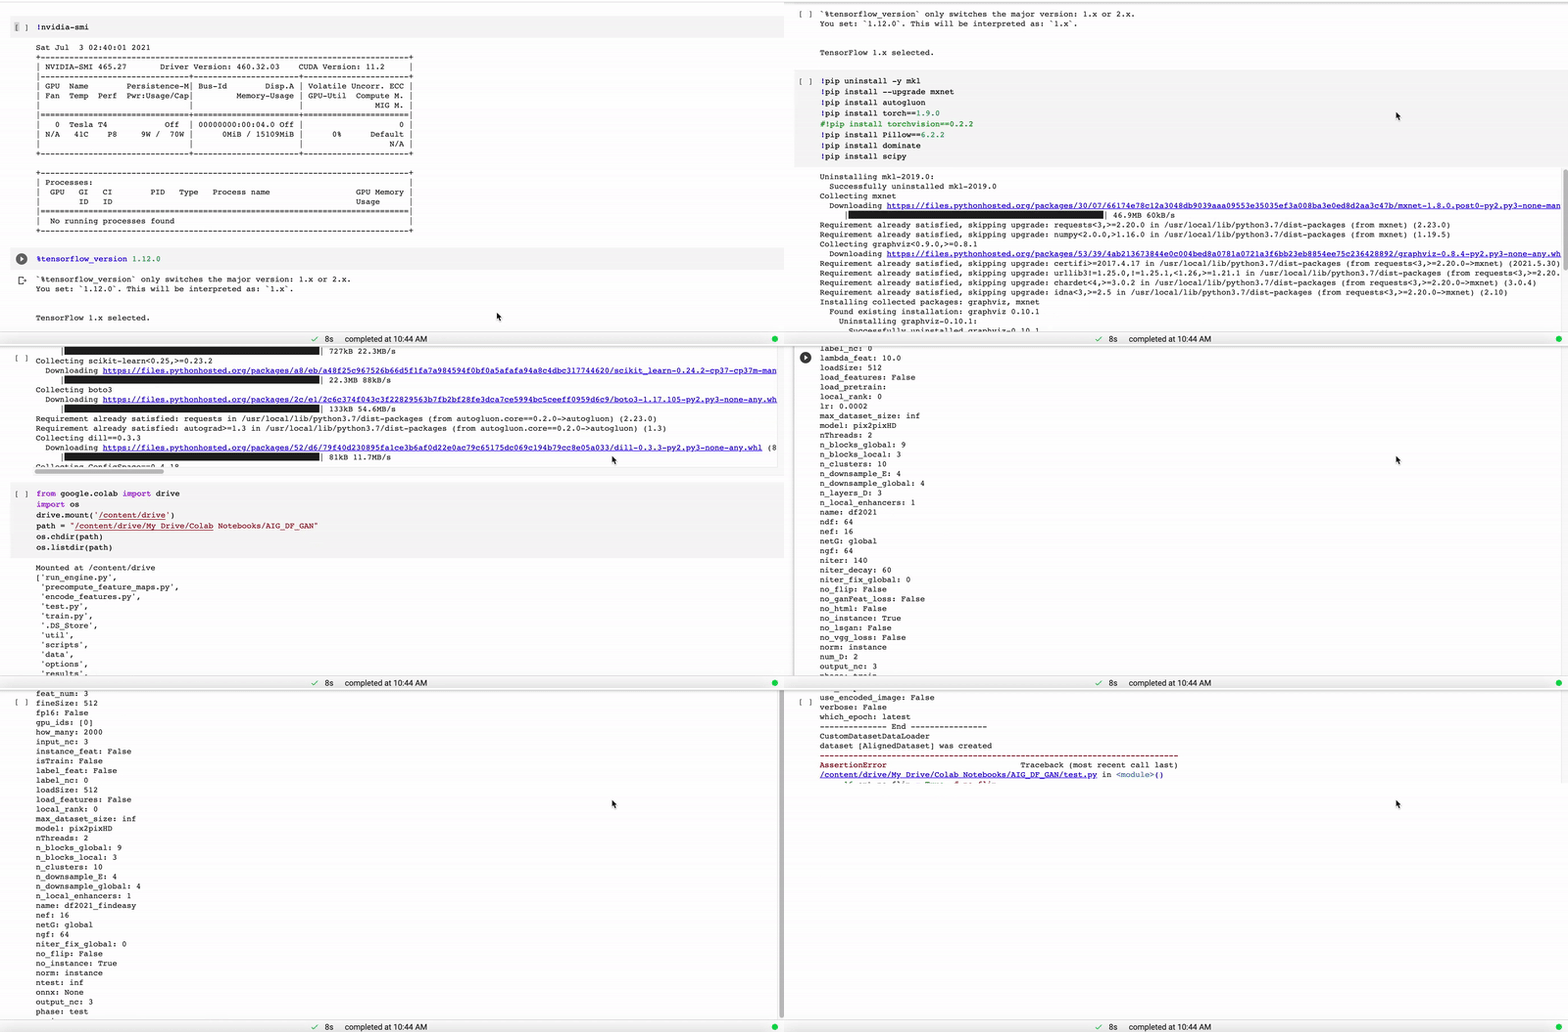
To investigate the correlation between POI hot map and urban spatial structure, we used the Generative Adversarial Network (GAN) neural network model for training. In order to increase the number of training samples to improve the accuracy of the model, we sliced the overall urban spatial structure map of Shanghai and the POI hot map to form 200 sets of one-to-one training samples.
Training Image Set
Input

Training Process

Predicting Image Set
Output

03 Product Application
By studying the vitality map of the city which has developed tourism, AI can predict the potential vitality map of another developing city. We applied this outcome to a digital product to help shop runners who look for housing find places with the most potential for commercial success. Users can find the available stores that are located within the vitality areas in the city and connect to the landlord. This product indirectly affects the development of the city.
.png)
01 Chose city
02 AI predicts the city vibrancy
03 Show available shop within the vibrant area
.png)
04 Chose an avaiable shop
05 See more information
06 Contact with landlord
REFLECTION
01 Consequences &
Algorithm Justice
At the end of this project, we try to reflect on it, analyze its shortcomings and plan the directions and methods of the next step.
The trained neural network model's prediction results for other cities' POI maps are flawed for two reasons. On one hand, it is due to insufficient training data input; on the other hand, the POI data used as training contains two different aspects. The vitality points generated from the bottom-up activities represent residents' quotidian activities should be screened out and analyzed from the points generated due to the high quality of the urban space itself.
This flaw in AI algorithm and data mapping will inevitably lead to the unequal development of cities. Resources will further accumulate in areas with high spatial quality while decreasing in undeveloped areas with a high density of daily activities. The algorithm injustice reflected in this outcome will wipe out everydayness in the city.

02 Improvement
Approaches
In this regard, we plan to train the same data with three new machine learning models: small sample learning, migration learning, and expert learning. To better optimize this product, we can respectively train these three models, comparing the prediction accuracy of the three with the original one. More specifically, Small-sample learning is suitable for the case where the amount of data is relatively small. Migration learning can improve prediction accuracy by establishing mathematical mapping relationships of spatial structure maps between different cities. Expert learning can make the different dimensions contained in the training data get different weights in the training process by manually labeling some feature data.
At the same time, a corrective coordination mechanism based on prediction results and a bottom-up human feedback mechanism is crucial to avoid algorithm injustice. Firstly, We can use specific algorithms to appropriately narrow the differences between prediction results before the results are presented to users. This method can promote users' independent thinking based on the reference data and avoid blindly following the prediction results. Secondly, setting up a scoring system and an incentive mechanism to invite bottom-up feedback from businesses already settled in a specific urban space will decrease the potential urban space bias.

Finally, the most crucial reason behind the data is the complexity of urban spaces, public spaces, time-sensitive activities, traffic conditions, population numbers, and age structures. All of those factors influence the birth and death of vibrant urban areas. When a single data source cannot provide clear and timely feedback, the product needs to provide multi-level and multi-dimensional mapping for users to query and think. The layered mappings are also the future development direction of this product - a more diversified, fair, timely, and effective "city vitality map in the eyes of AI."
